
2023-08 August Updates
Summary:
- IMPORTANT: if you use the Registers module - there's a change to the display of due dates
- There's also a new timeline visual indicator to match records to repeating due dates in Registers
- Charts format is now updated in all modules, and there are new charts for cost reporting
- Copy-pasting a screenshot or other image into an Issue description now works
- plus other updates for more bulk actions, inactive content, and bug fixes.
New Charts
The new charts formats are now available in all modules. To have a look, switch over to the reports tab in any module:

We've added some new charts showing costs per year and costs per month. As with other charts, these respond to your search options, so you could search by Issue Type to look for trends in Nonconformance costs:

Here's some more information on tracking costs in Toolbox.
Registers - Visual Timeline
Records and repeating due dates in the Registers module have been a source of confusion for many users, so we've made some changes to try to clarify what's going on.
The most obvious change is a new timeline visual to show how your records match up to the repeating due dates. A green tick means done, red is for late/missed, and we'll show a blue "+" for the due date coming up. Click the icon to add a record and 'tick off' that due date as done.
Here's how it looks for a report that needs to be submitted monthly on the 15th:
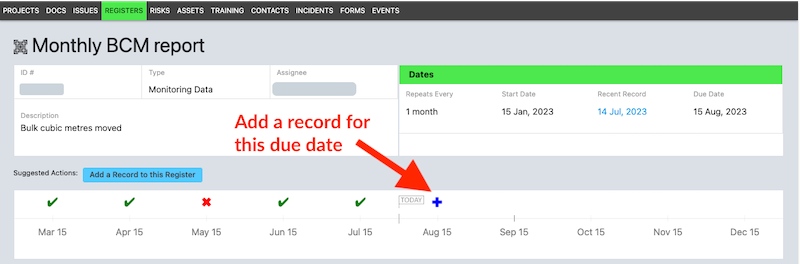
You can see the repeat due dates along the bottom of the timeline, on the 15th of each month. There are records in the system for March, April, June, and July (these dates have green ticks). The red cross over the top of May shows that there's no record in the system matched up to this due date.
To add a record for May, hover over the top of the red cross and click the add button that appears. To add a record for the upcoming due date in August, click the add button over that date.
You can still add records that don't correspond to any of the displayed due dates using the "Add a Record to this Register" button - as before.
Registers Due Date Display
The overall next due date displayed for a Register has changed to make it more obvious when a Register is late. If you missed the monthly report last month, then you'll see last month as the due date (in red, because it's late).

Toolbox previously always showed the next due date after today, and was never in red no matter how many due dates you'd missed. The Registers list view will show now those late Register due dates in red, so it's easier to see what needs attention:

If you suddenly see a bunch of red 'late' due dates in your Registers list view and wonder how you missed them before, this change is the reason why.
COPY & PASTE an image into an Issue
No need to save a screenshot first and then upload it. Just paste straight into the description text.

New 'Bulk Actions' for document reviewers, and follow/unfollow
Toolbox has 'Bulk Actions' for editing multiple items at the same time. In Documents, you could already add/remove the Editor and the Approver for multiple documents. Now you can also add (or remove) Reviewers to multiple documents at once.
It's also now possible to follow / unfollow multiple items of content all at once. Following content means you receive notifications for activity on those items, and can also take advantage of the 'FOLLOWING' search tab to quickly pull up just the items you follow:

Minor changes and bug fixes
- Registers can be made INACTIVE to hide them and stop due date reminders without losing any data
- Inactive Employees and Assets are now hidden on a couple of views where they still showed up
- Inactive Projects don't show up on charts by project, e.g. Issues by Project, Assets by Project, etc
- Cleaned up export data to remove html coding from description field text